CBOE Volatility Index
The VIX measures the market's expectation of 30-day forward-looking volatility, derived from S&P 500 index options. Often called the 'fear gauge,' it rises during periods of market uncertainty.
The most striking divergence in VIX seasonal data sits between its general 10-year history and its midterm election year pattern. Over the past decade, the VIX has risen in just 3 of 10 periods across every time horizon, with the 90-day window showing VIX increasing only 2 of 10 times, signaling historically favorable conditions for equities ahead. Yet midterm election years tell a different story: VIX rose in 6 of 8 instances over 60 days, with an average increase of nearly 12%, pointing toward elevated market anxiety through the election cycle.
Currently at 17.03 following a sharp 9.46% decline, the VIX sits in calm territory. Investors should watch whether midterm uncertainty overrides the typically benign seasonal trend, as rising volatility would signal meaningful stress for equity portfolios.
Seasonal Price Projections
Select a historical basis and projection horizon to see where seasonal patterns suggest CBOE Volatility Index may be headed.
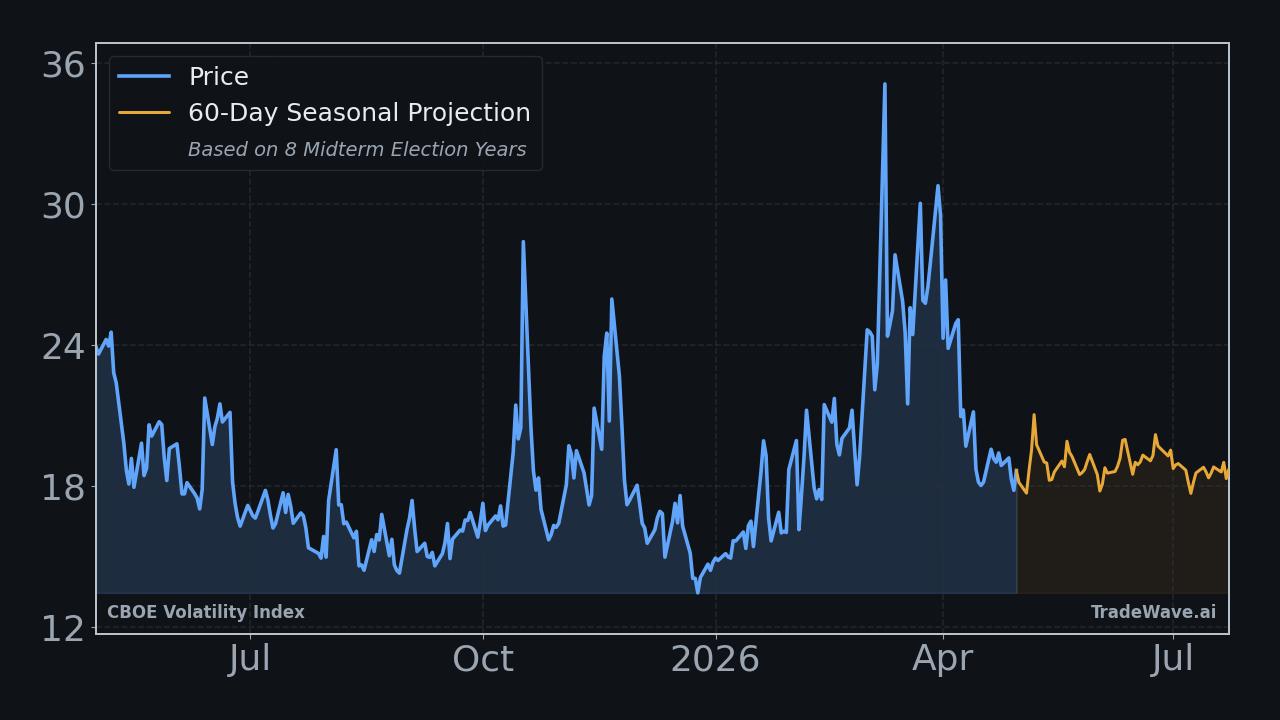
Projection as of May 15, 2026 from closing price $17.03
How to Use This Data
Seasonal projections for the CBOE Volatility Index summarize how VIX has behaved during this same calendar period across historical years. In consecutive years, VIX increased in only 30.0% of these periods, suggesting relative calm. In midterm election years specifically, VIX increased in 75.0% of periods, signaling that election cycles have historically corresponded with elevated market anxiety.
The two bases currently diverge, pointing in opposite directions, which means the election-year pattern and recent consecutive history are telling different stories about likely conditions. When bases diverge, neither signal should be treated as definitive. The median return is often more informative than the average in these cases, as extreme outlier years like the worst recorded period of -32.0% can distort averages significantly.
Seasonal patterns cannot account for sudden geopolitical developments, policy shifts, earnings surprises, or macroeconomic shocks. A historically high VIX-increase rate does not guarantee volatility will spike in any given year. These projections reflect statistical tendencies across past periods, not predictions of future outcomes.
Market participants often use seasonal data as one contextual layer alongside technical analysis, economic indicators, and portfolio risk frameworks. Understanding historical VIX behavior during specific calendar windows can help set expectations about potential equity market turbulence, without substituting for comprehensive analysis.
This information is provided for educational purposes only and does not constitute financial advice, a recommendation, or a solicitation to buy or sell any security. Seasonal patterns are based on historical data and do not guarantee future performance. All investment decisions carry risk. Consult a qualified financial advisor before making investment decisions.
Understanding Seasonal Projections
Seasonal projections estimate future price movement based on how CBOE Volatility Index has historically performed during the same calendar period. These are statistical baselines derived from decades of market data, not predictions.
Consecutive Years (Last 10)
Uses the most recent 10 years of data regardless of market regime. This captures the broadest recent behavior, including all economic and political environments. Over the next 60 trading days, this pattern has been positive 3 of 10 times with an average return of -9.8%.
Midterm Election Years (8 Available)
Uses only years that fall in the same position within the 4-year U.S. presidential election cycle. 2026 is a midterm election year. Markets often exhibit distinct patterns tied to fiscal and monetary policy shifts within this cycle. In 8 historical midterm election years, this 60-day window was positive 6 times with an average return of +11.9%.
Seasonal patterns reflect historical tendencies and do not guarantee future results. All projections are based on past performance and should be used as one input among many in your investment decision-making process. Data provided by TradeWave.ai.
Explore More
Other markets with seasonal analysis and recent pattern articles.