Crude Oil (WTI)
West Texas Intermediate (WTI) crude oil is the primary benchmark for U.S. oil pricing. It is one of the most actively traded commodities in the world.
The seasonal picture for WTI crude splits sharply depending on which lens you apply. The last 10 consecutive years show a 60% win rate over both 60- and 90-day horizons with average returns near 9-10%, suggesting meaningful upside from current levels near $105.89. But midterm election years tell a different story: 30-day win rates drop to just 40% with an average return of negative 2.15%, pointing toward a near-term pullback to roughly $104.
Crude oil's seasonal behavior is notoriously sensitive to political cycles, and midterm years historically suppress near-term momentum before recovering modestly by the 90-day mark, where win rates climb back to 60%. Traders should watch whether the broader 10-year seasonal tailwind reasserts itself or the midterm headwind dominates through the short window.
Seasonal Price Projections
Select a historical basis and projection horizon to see where seasonal patterns suggest Crude Oil (WTI) may be headed.
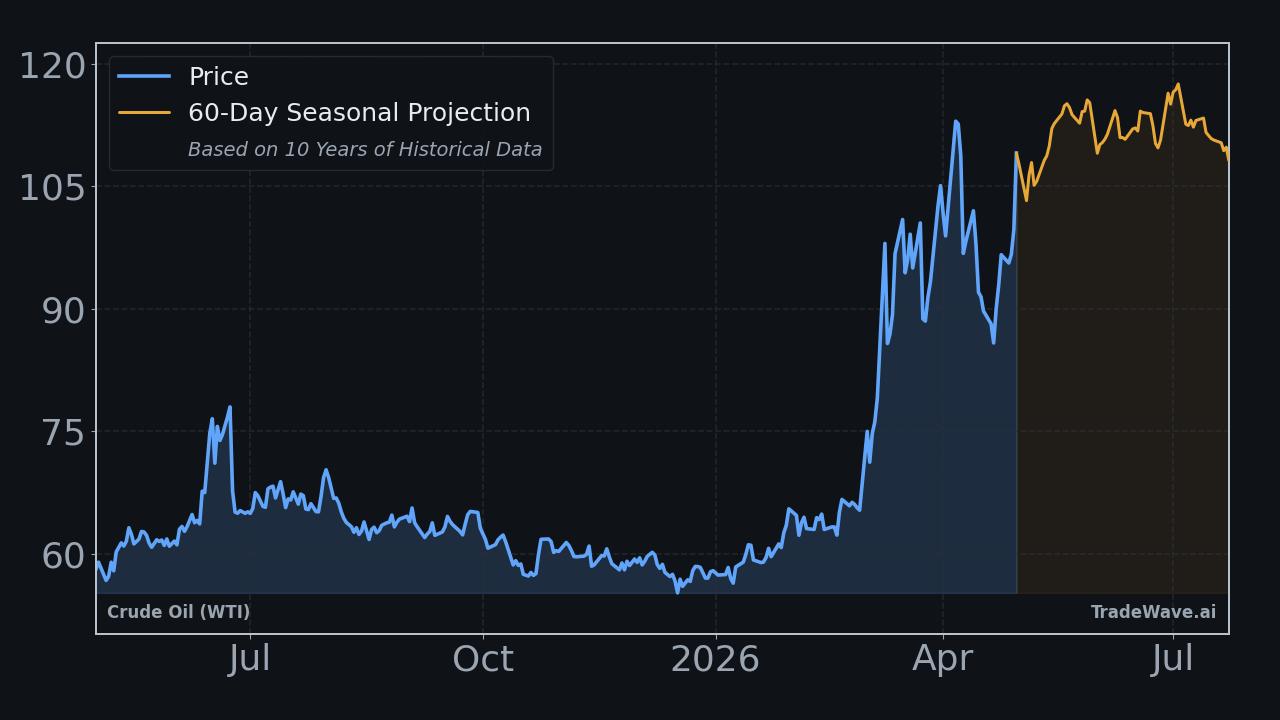
Projection as of May 15, 2026 from closing price $105.89
How to Use This Data
Seasonal projection data for Crude Oil (WTI) summarizes how the commodity has historically performed during this same calendar period across prior years. The consecutive pattern carries a 60.0% win rate, meaning WTI finished higher in 60 out of every 100 comparable historical periods. The midterm election year pattern shows a 50.0% win rate, reflecting a more neutral historical tendency during those specific cycles.
When both the consecutive and midterm election year bases point in the same direction, the signal carries more consistency than when they diverge. Here, both bases project negative returns, which reinforces the directional tendency. The median return is often more useful than the average because it is less distorted by outliers like the historical best of plus 76.5%, which can skew averages significantly.
Seasonal patterns are built entirely from historical price behavior and cannot account for geopolitical developments, supply disruptions, policy shifts, or macroeconomic surprises. A 60.0% win rate still implies the opposing outcome occurred 40.0% of the time. These projections represent statistical tendencies, not predictions of what will happen in any given year.
Market participants often use seasonal data as one layer of context alongside fundamental supply and demand analysis, technical price levels, and broader risk frameworks. Seasonal tendencies can inform expectations about timing and historical norms without serving as a standalone basis for any decision.
This information is provided for educational purposes only and does not constitute financial advice, a recommendation, or a solicitation to buy or sell any security. Seasonal patterns are based on historical data and do not guarantee future performance. All investment decisions carry risk. Consult a qualified financial advisor before making investment decisions.
Understanding Seasonal Projections
Seasonal projections estimate future price movement based on how Crude Oil (WTI) has historically performed during the same calendar period. These are statistical baselines derived from decades of market data, not predictions.
Consecutive Years (Last 10)
Uses the most recent 10 years of data regardless of market regime. This captures the broadest recent behavior, including all economic and political environments. Over the next 60 trading days, this pattern has been positive 6 of 10 times with an average return of +9.9%.
Midterm Election Years (10 Available)
Uses only years that fall in the same position within the 4-year U.S. presidential election cycle. 2026 is a midterm election year. Markets often exhibit distinct patterns tied to fiscal and monetary policy shifts within this cycle. In 10 historical midterm election years, this 60-day window was positive 5 times with an average return of -1.7%.
Seasonal patterns reflect historical tendencies and do not guarantee future results. All projections are based on past performance and should be used as one input among many in your investment decision-making process. Data provided by TradeWave.ai.
Explore More
Other markets with seasonal analysis and recent pattern articles.