Gold
COMEX Gold futures are the world's most liquid gold contract. Gold serves as a store of value, inflation hedge, and safe-haven asset during periods of geopolitical uncertainty.
The seasonal picture for gold splits sharply depending on which lens you use. Over the last ten consecutive years, the 90-day window shows a 70% win rate with a projected return of 13.13%, pointing toward $5,155. But midterm election years tell a starkly different story: that same 90-day window carries just a 17% win rate and a projected decline of nearly 20%, targeting $3,657.
Gold's behavior in midterm years reflects historically elevated uncertainty that pressures safe-haven positioning once political clarity emerges. The divergence between the broad seasonal trend and the cycle-specific pattern is unusually wide here. Traders should watch whether gold holds current levels through the 30-day window, where midterm history already signals a 6.7% drawdown risk.
Seasonal Price Projections
Select a historical basis and projection horizon to see where seasonal patterns suggest Gold may be headed.
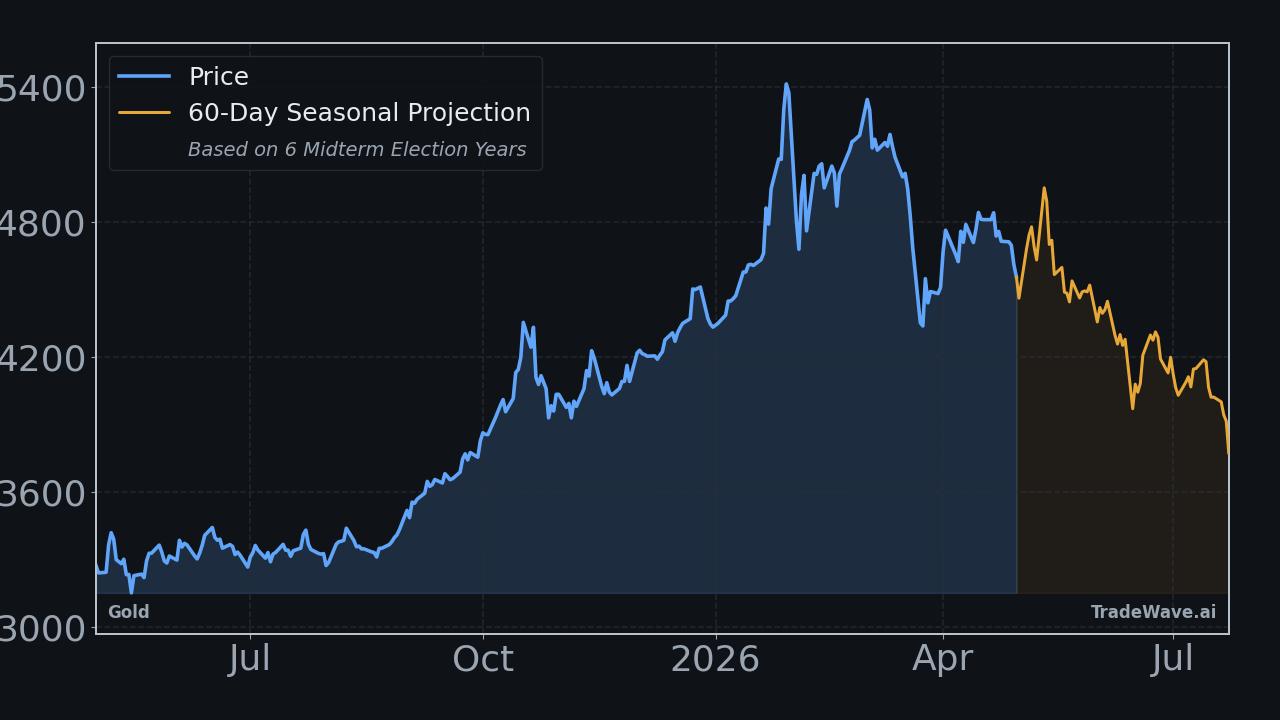
Projection as of May 15, 2026 from closing price $4,576.00
How to Use This Data
Seasonal projection data for Gold illustrates how the commodity has historically performed during this specific calendar window. The consecutive pattern shows a 50.0% win rate, meaning Gold finished higher in exactly half of the comparable historical periods. The midterm election year pattern carries the same win rate but tells a meaningfully different story through its returns.
When the two bases diverge, as they do here, it signals that the election cycle context has historically produced different outcomes than the broader consecutive pattern alone would suggest. The consecutive basis projects a return of plus 2.9%, while the midterm election year basis projects minus 17.3%, a significant gap. Median returns are often more reliable reference points than averages, since a single extreme year can distort the average considerably.
Seasonal patterns reflect historical tendencies and cannot anticipate geopolitical developments, central bank policy shifts, currency movements, or sudden changes in demand. A 50.0% win rate carries no predictive guarantee for any individual year, and the projection represents a statistical tendency rather than a forecast of what will occur.
Market participants often use seasonal data as one layer within a broader analytical framework that includes fundamental research and technical analysis. Understanding historical tendencies can help contextualize expectations and timing, but seasonal data works best when viewed alongside other information rather than in isolation.
This information is provided for educational purposes only and does not constitute financial advice, a recommendation, or a solicitation to buy or sell any security. Seasonal patterns are based on historical data and do not guarantee future performance. All investment decisions carry risk. Consult a qualified financial advisor before making investment decisions.
Understanding Seasonal Projections
Seasonal projections estimate future price movement based on how Gold has historically performed during the same calendar period. These are statistical baselines derived from decades of market data, not predictions.
Consecutive Years (Last 10)
Uses the most recent 10 years of data regardless of market regime. This captures the broadest recent behavior, including all economic and political environments. Over the next 60 trading days, this pattern has been positive 5 of 10 times with an average return of +0.6%.
Midterm Election Years (6 Available)
Uses only years that fall in the same position within the 4-year U.S. presidential election cycle. 2026 is a midterm election year. Markets often exhibit distinct patterns tied to fiscal and monetary policy shifts within this cycle. In 6 historical midterm election years, this 60-day window was positive 3 times with an average return of -0.8%.
Seasonal patterns reflect historical tendencies and do not guarantee future results. All projections are based on past performance and should be used as one input among many in your investment decision-making process. Data provided by TradeWave.ai.
Explore More
Other markets with seasonal analysis and recent pattern articles.