Natural Gas
Henry Hub Natural Gas futures represent the benchmark price for natural gas in North America, heavily influenced by weather patterns and seasonal demand.
The seasonal picture for natural gas carries a sharp internal conflict. Over the last 10 years, the 30-day window shows a 60% win rate with a projected gain of 3.40%, but midterm election years tell a starkly different story: just a 37.5% win rate and a projected loss of 2.28% over the same horizon. Stretch to 90 days and the divergence widens further, with midterm years projecting a 17.94% decline versus a 10.53% gain in the broader dataset.
Natural gas is notoriously sensitive to political and regulatory cycles, and midterm years historically suppress the commodity's typical seasonal strength. With current price at $2.802, the key watch point is whether demand catalysts can override the election-year headwind before the 60-day window closes.
Seasonal Price Projections
Select a historical basis and projection horizon to see where seasonal patterns suggest Natural Gas may be headed.
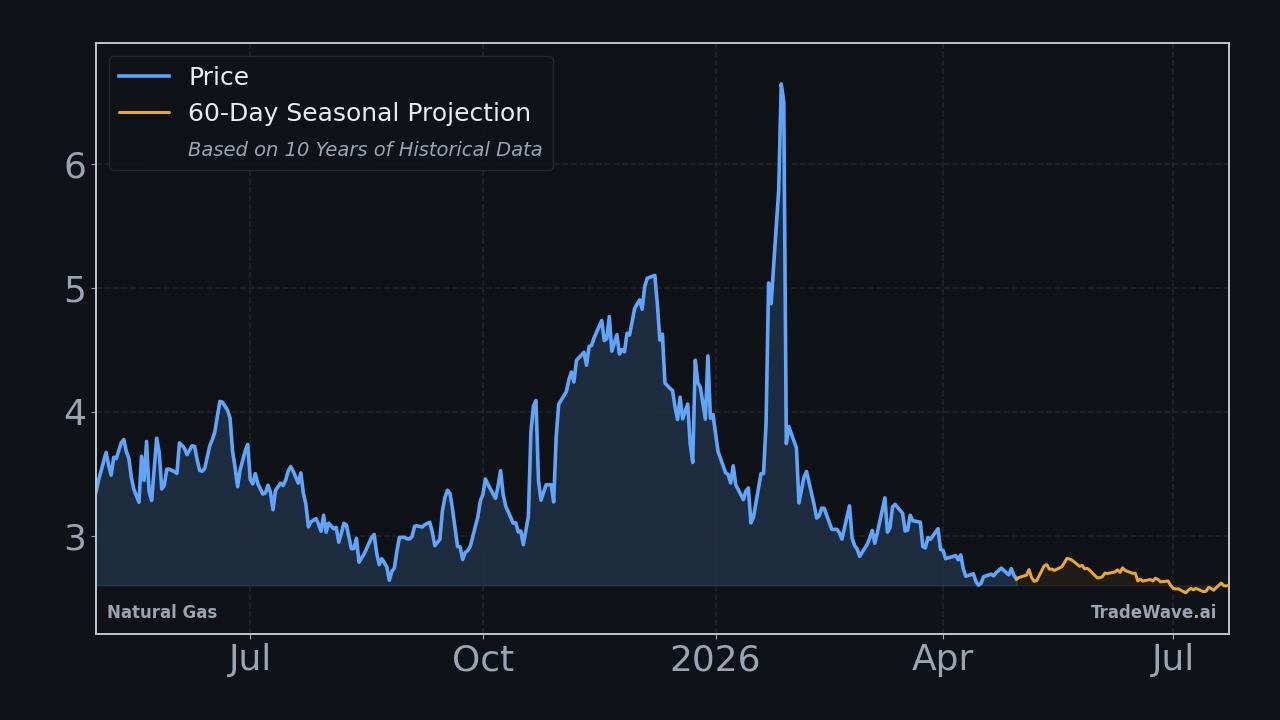
Projection as of May 15, 2026 from closing price $2.8020
How to Use This Data
Seasonal projection data for Natural Gas shows how the commodity has historically performed during this same calendar period across past years. The consecutive pattern reflects a 50.0% win rate, meaning Natural Gas closed higher in exactly half of those historical periods. The midterm election year pattern also shows a 50.0% win rate, with an average return of negative 2.6%.
When both the consecutive and midterm election year bases point in the same direction, the signal carries more consistency than when they diverge. Here, both project negative returns, which represents a degree of convergence worth noting. The median return is often more informative than the average because it is less distorted by extreme outliers like the historical best of positive 43.2% or worst of negative 28.7%.
Seasonal patterns cannot account for supply disruptions, geopolitical developments, policy shifts, or unexpected weather events that frequently drive Natural Gas prices. A 50.0% win rate does not guarantee any particular outcome in the current year. These projections reflect statistical tendencies drawn from the past, not predictions of future performance.
Market participants often use seasonal data as one layer of context alongside fundamental supply and demand analysis, technical price indicators, and broader macroeconomic conditions. Seasonal tendencies can inform how participants frame expectations and interpret timing, but they function best as one input among many rather than a standalone signal.
This information is provided for educational purposes only and does not constitute financial advice, a recommendation, or a solicitation to buy or sell any security. Seasonal patterns are based on historical data and do not guarantee future performance. All investment decisions carry risk. Consult a qualified financial advisor before making investment decisions.
Understanding Seasonal Projections
Seasonal projections estimate future price movement based on how Natural Gas has historically performed during the same calendar period. These are statistical baselines derived from decades of market data, not predictions.
Consecutive Years (Last 10)
Uses the most recent 10 years of data regardless of market regime. This captures the broadest recent behavior, including all economic and political environments. Over the next 60 trading days, this pattern has been positive 5 of 10 times with an average return of +1.8%.
Midterm Election Years (8 Available)
Uses only years that fall in the same position within the 4-year U.S. presidential election cycle. 2026 is a midterm election year. Markets often exhibit distinct patterns tied to fiscal and monetary policy shifts within this cycle. In 8 historical midterm election years, this 60-day window was positive 4 times with an average return of -2.6%.
Seasonal patterns reflect historical tendencies and do not guarantee future results. All projections are based on past performance and should be used as one input among many in your investment decision-making process. Data provided by TradeWave.ai.
Explore More
Other markets with seasonal analysis and recent pattern articles.