S&P 500
The S&P 500 index tracks 500 of the largest U.S. publicly traded companies, weighted by market capitalization. It is widely regarded as the best single gauge of the U.S. equity market.
The recent 1.11% gain masks a sharp seasonal divide: the last 10 years project a 6.15% to 25.29% gain over the next 30 to 90 days with win rates reaching 90%, but midterm election year history tells the opposite story, showing negative average returns across all three horizons and win rates collapsing to 38% to 46%.
That tension is the central story for the S&P 500 right now. Midterm years historically generate meaningful drawdowns as political uncertainty weighs on sentiment, with 60-day returns averaging negative 2.28% versus a positive 3.61% in the broader 10-year window. The gap between these two signals is unusually wide, making the midterm cycle pattern the dominant variable worth monitoring closely heading into the next quarter.
Seasonal Price Projections
Select a historical basis and projection horizon to see where seasonal patterns suggest S&P 500 may be headed.
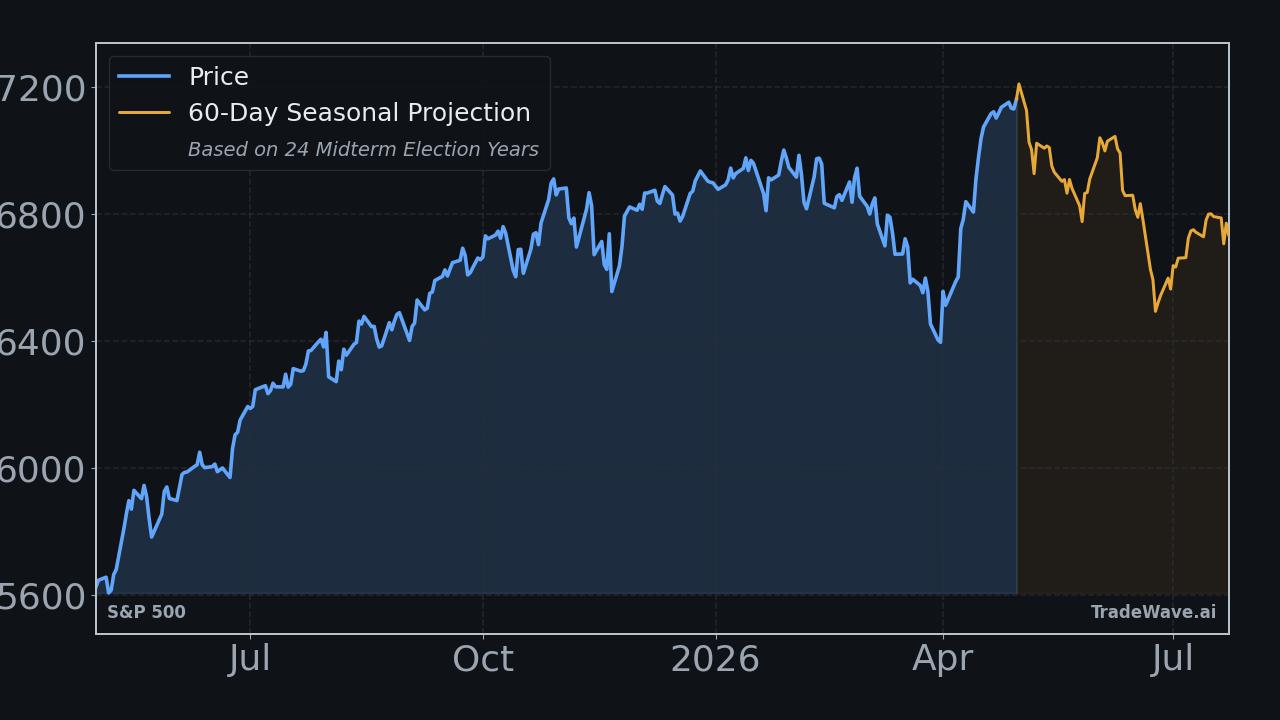
Projection as of May 15, 2026 from closing price $7,215.34
How to Use This Data
Seasonal projection data illustrates how the S&P 500 has historically performed during this exact calendar window across past years. The consecutive pattern shows a 90.0% win rate, meaning the index closed higher in 90 out of every 100 comparable periods. The midterm election year pattern tells a notably different story, with a win rate of just 37.5%.
When the two bases diverge as sharply as they do here, pointing in opposite directions, it signals that the election cycle has historically produced conditions distinct from the broader seasonal trend. The median return is often more informative than the average because it reduces distortion from outlier years, and here the medians of plus 2.6% and negative 2.4% reflect that divergence clearly.
Seasonal patterns cannot account for breaking news, Federal Reserve decisions, earnings surprises, geopolitical events, or sudden shifts in market sentiment. A 90.0% win rate does not guarantee a positive outcome in any single year. These figures represent statistical tendencies drawn from historical data, not forward-looking forecasts.
Market participants often treat seasonal data as one lens among several, pairing it with fundamental analysis, technical indicators, and their own risk frameworks. It can help contextualize timing and set realistic expectations about historical norms without replacing the broader analytical process.
This information is provided for educational purposes only and does not constitute financial advice, a recommendation, or a solicitation to buy or sell any security. Seasonal patterns are based on historical data and do not guarantee future performance. All investment decisions carry risk. Consult a qualified financial advisor before making investment decisions.
Understanding Seasonal Projections
Seasonal projections estimate future price movement based on how S&P 500 has historically performed during the same calendar period. These are statistical baselines derived from decades of market data, not predictions.
Consecutive Years (Last 10)
Uses the most recent 10 years of data regardless of market regime. This captures the broadest recent behavior, including all economic and political environments. Over the next 60 trading days, this pattern has been positive 9 of 10 times with an average return of +3.6%.
Midterm Election Years (24 Available)
Uses only years that fall in the same position within the 4-year U.S. presidential election cycle. 2026 is a midterm election year. Markets often exhibit distinct patterns tied to fiscal and monetary policy shifts within this cycle. In 24 historical midterm election years, this 60-day window was positive 9 times with an average return of -2.3%.
Seasonal patterns reflect historical tendencies and do not guarantee future results. All projections are based on past performance and should be used as one input among many in your investment decision-making process. Data provided by TradeWave.ai.
Explore More
Other markets with seasonal analysis and recent pattern articles.