Dow Jones Industrial Average
The Dow Jones Industrial Average tracks 30 prominent blue-chip companies listed on U.S. stock exchanges. It is one of the oldest and most-watched indices in the world.
The sharpest divergence in this dataset is between recent momentum and midterm history. The last 10 years show a 90% win rate over 60 and 90 days, projecting gains of 17% and 19% respectively. But midterm election years tell a starkly different story: 60-day win rates collapse to 33%, with an average loss of 2.58% and a projected target near 45,350.
At 49,717, the Dow sits at a crossroads where cyclical headwinds historically overwhelm recent trends. Midterm years carry a well-documented summer correction pattern, and the 38.9% 30-day win rate signals near-term vulnerability. Watch whether the index holds above 46,700 over the next month. A break below that level would confirm the midterm seasonal script is playing out.
Seasonal Price Projections
Select a historical basis and projection horizon to see where seasonal patterns suggest Dow Jones Industrial Average may be headed.
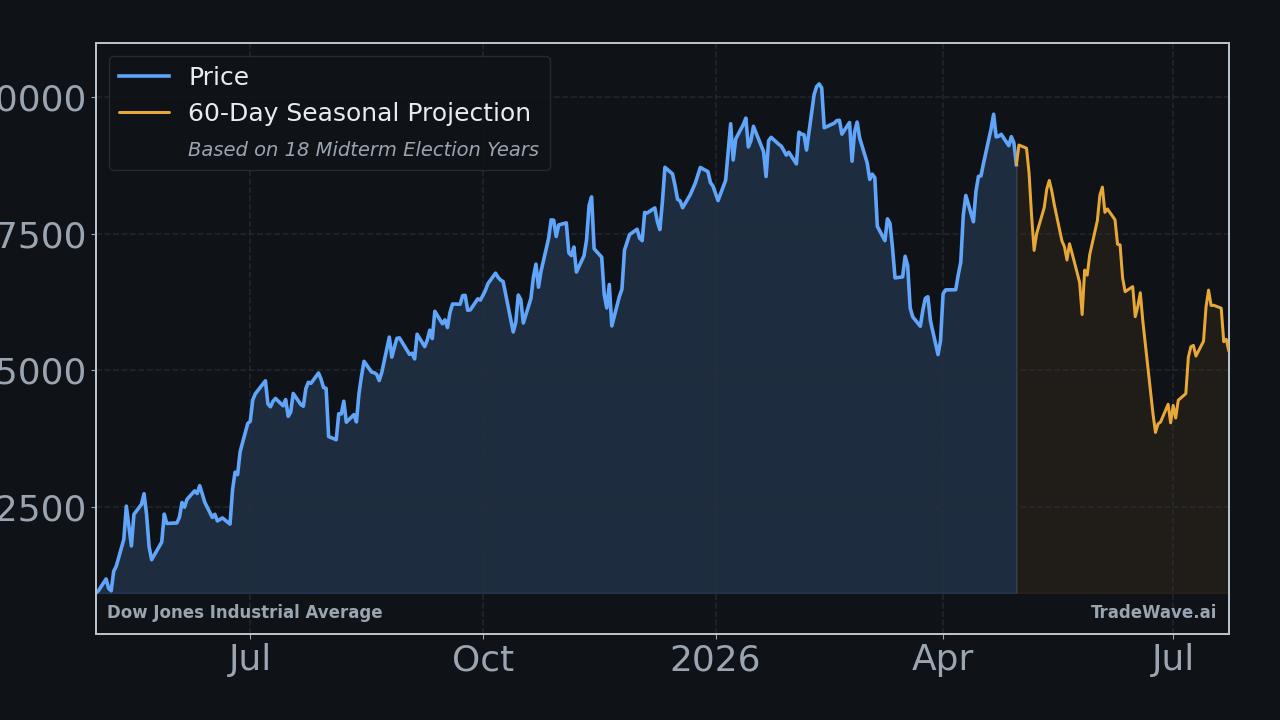
Projection as of May 15, 2026 from closing price $49,716.94
How to Use This Data
Seasonal projection data for the Dow Jones Industrial Average reflects how the index has historically performed during this same calendar period across prior years. The consecutive pattern shows a 90.0% win rate, meaning the DJIA finished higher in 9 out of 10 comparable historical periods, with an average return of +2.0%.
When the two bases diverge as they do here, the data is sending mixed signals. The consecutive pattern projects +17.1% while the midterm election year pattern projects -7.0%, with a much lower 33.3% win rate, suggesting the election cycle has historically created meaningfully different conditions. The median return of -2.6% in midterm years is often more reliable than the average because it is less distorted by outlier years.
Seasonal patterns cannot account for sudden policy shifts, earnings surprises, geopolitical developments, or macroeconomic shocks. A 90.0% win rate still includes losing years, and past tendencies carry no guarantee about any single future period. These projections describe statistical tendencies, not forecasts.
Market participants often use seasonal data as one layer of context alongside fundamental analysis, technical indicators, and broader economic conditions. Understanding historical tendencies during specific calendar periods can help frame expectations, but no single data source captures the full picture of market behavior.
This information is provided for educational purposes only and does not constitute financial advice, a recommendation, or a solicitation to buy or sell any security. Seasonal patterns are based on historical data and do not guarantee future performance. All investment decisions carry risk. Consult a qualified financial advisor before making investment decisions.
Understanding Seasonal Projections
Seasonal projections estimate future price movement based on how Dow Jones Industrial Average has historically performed during the same calendar period. These are statistical baselines derived from decades of market data, not predictions.
Consecutive Years (Last 10)
Uses the most recent 10 years of data regardless of market regime. This captures the broadest recent behavior, including all economic and political environments. Over the next 60 trading days, this pattern has been positive 9 of 10 times with an average return of +2.0%.
Midterm Election Years (18 Available)
Uses only years that fall in the same position within the 4-year U.S. presidential election cycle. 2026 is a midterm election year. Markets often exhibit distinct patterns tied to fiscal and monetary policy shifts within this cycle. In 18 historical midterm election years, this 60-day window was positive 6 times with an average return of -2.6%.
Seasonal patterns reflect historical tendencies and do not guarantee future results. All projections are based on past performance and should be used as one input among many in your investment decision-making process. Data provided by TradeWave.ai.
Explore More
Other markets with seasonal analysis and recent pattern articles.