Key Takeaways:
- The Wave Viewer is a core tool for analyzing historical trading wave patterns across securities.
- You can instantly load a wave by selecting an opportunity or creating a fully custom setup.
- Interactive controls allow you to adjust timeframes, trend views, and wave parameters in real time.
- Built-in export and portfolio tools help you save, track, and operationalize your analysis.
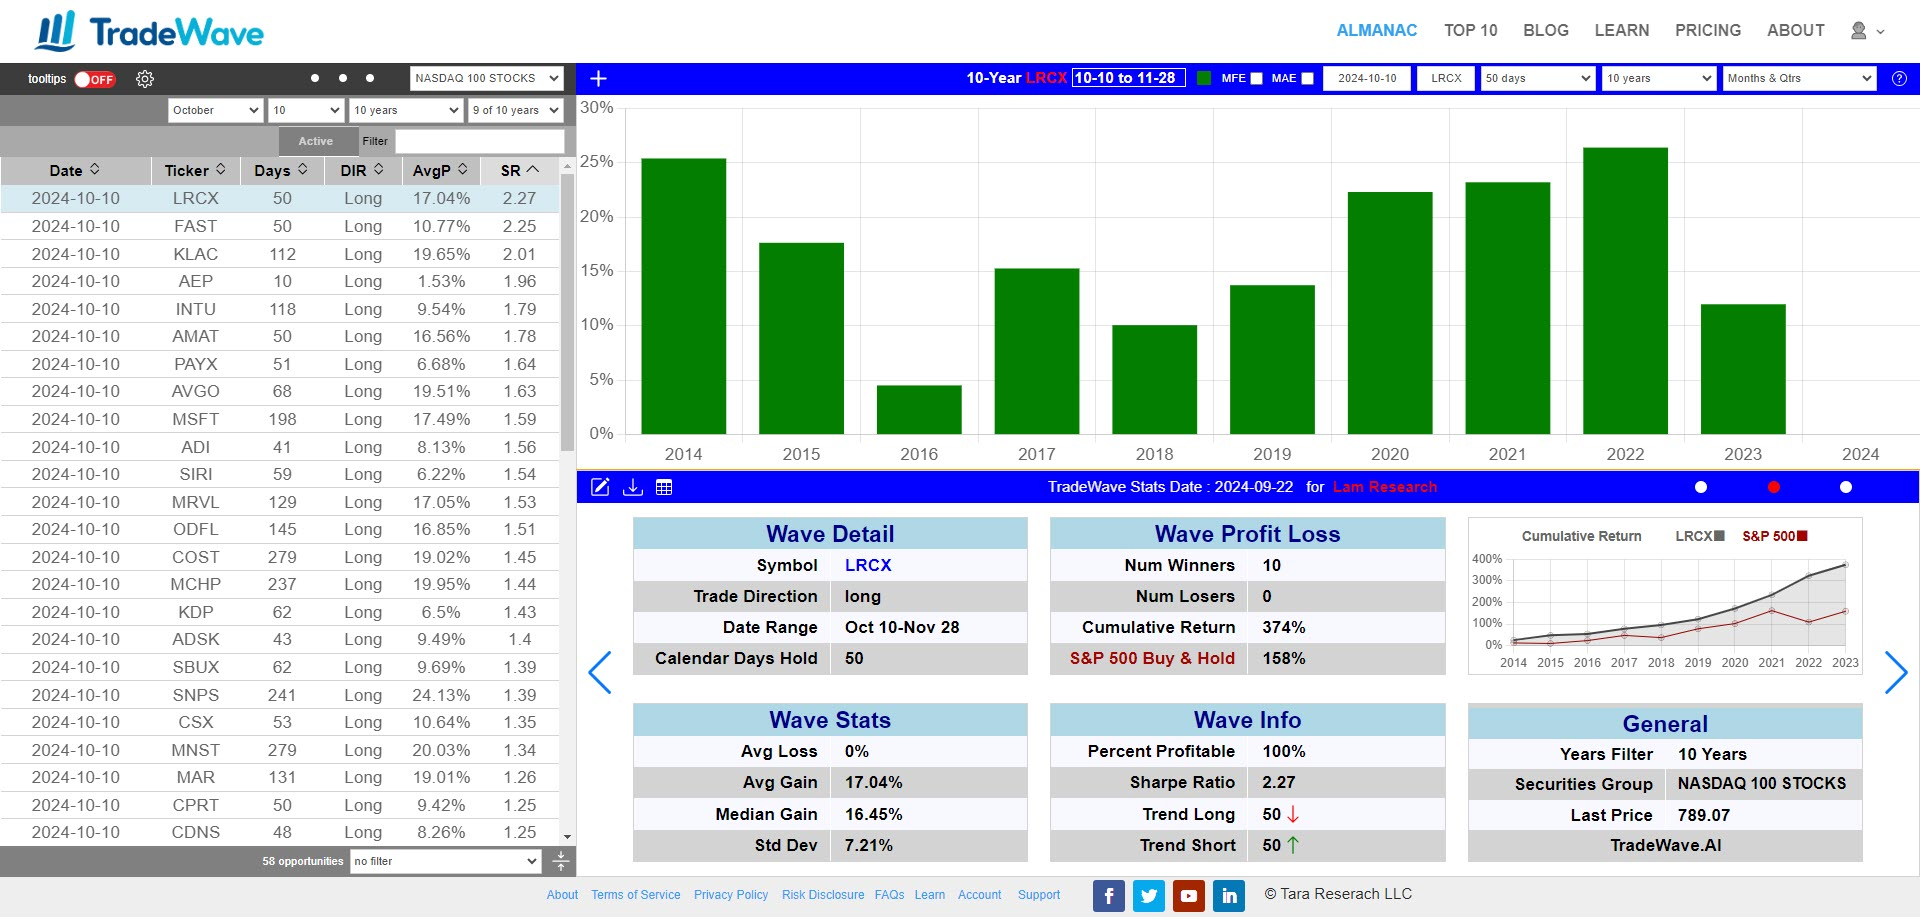
What Is the Wave Viewer in TradeWave?
The Wave Viewer is TradeWave’s primary interface for exploring and analyzing trading wave patterns. It allows traders to evaluate historical performance, customize inputs like timeframes and tickers, and interact with data visually to uncover potential opportunities.
Whether you’re reviewing pre-identified opportunities or building your own custom wave analysis, the Wave Viewer is designed to make pattern recognition and strategy testing intuitive and efficient.
How to Load a Wave in the Wave Viewer
There are two simple ways to load and analyze a trading wave:
1. Select an Opportunity from the Table
Click any opportunity in the Opportunities Table to automatically load its corresponding wave into the Wave Viewer. This is the fastest way to explore historical performance and validate existing setups.
2. Create a Custom Wave Pattern
Manually input your own parameters directly into the Wave Viewer, including: - Start Date - Ticker symbol - Number of days - Years analyzed
This approach allows you to build and analyze custom trading wave patterns for any security, giving you full control over your research.
How to Customize the Opportunities Table for Better Analysis
The Opportunities Table is fully interactive, allowing you to refine your analysis dynamically:
View the Trend Chart
Click the left navigation dot on the horizontal blue ribbon to display the Trend Chart. This chart provides a broader market context, helping you align wave analysis with overall price trends.
Adjust Timeframes and Parameters
- Drag the left edge of the table to change the start date
- Drag the right edge to adjust the number of days or end date
These controls make it easy to fine-tune your wave inputs and test different scenarios without leaving the interface.
Wave Viewer Tools: Downloads, Data, and Portfolio Tracking
The horizontal blue ribbon includes several tools to extend your analysis:
Export Your Analysis
- Use Download JPG to save a visual snapshot of your wave analysis
- Use Download CSV to export data for deeper analysis (available in the Stats Table view)
To access the Stats Table, click the center navigation dot.
Save Waves to Your Portfolio
Click the leftmost portfolio icon to add a wave to your portfolio. This allows you to track, revisit, and manage your preferred trading opportunities over time.
Why the Wave Viewer Matters for Traders
The Wave Viewer combines data visualization, customization, and workflow tools into a single interface. By enabling both quick exploration and deep analysis of trading wave patterns, it helps traders move from idea generation to actionable insight more efficiently.