Key Takeaways
- The Trend Chart visualizes seasonal market behavior across multiple years.
- Detrended data helps isolate recurring seasonal patterns from long-term market growth.
- Traders can identify historically strong periods for potential entries and exits.
- Consistent patterns across years may indicate higher-probability trading opportunities.
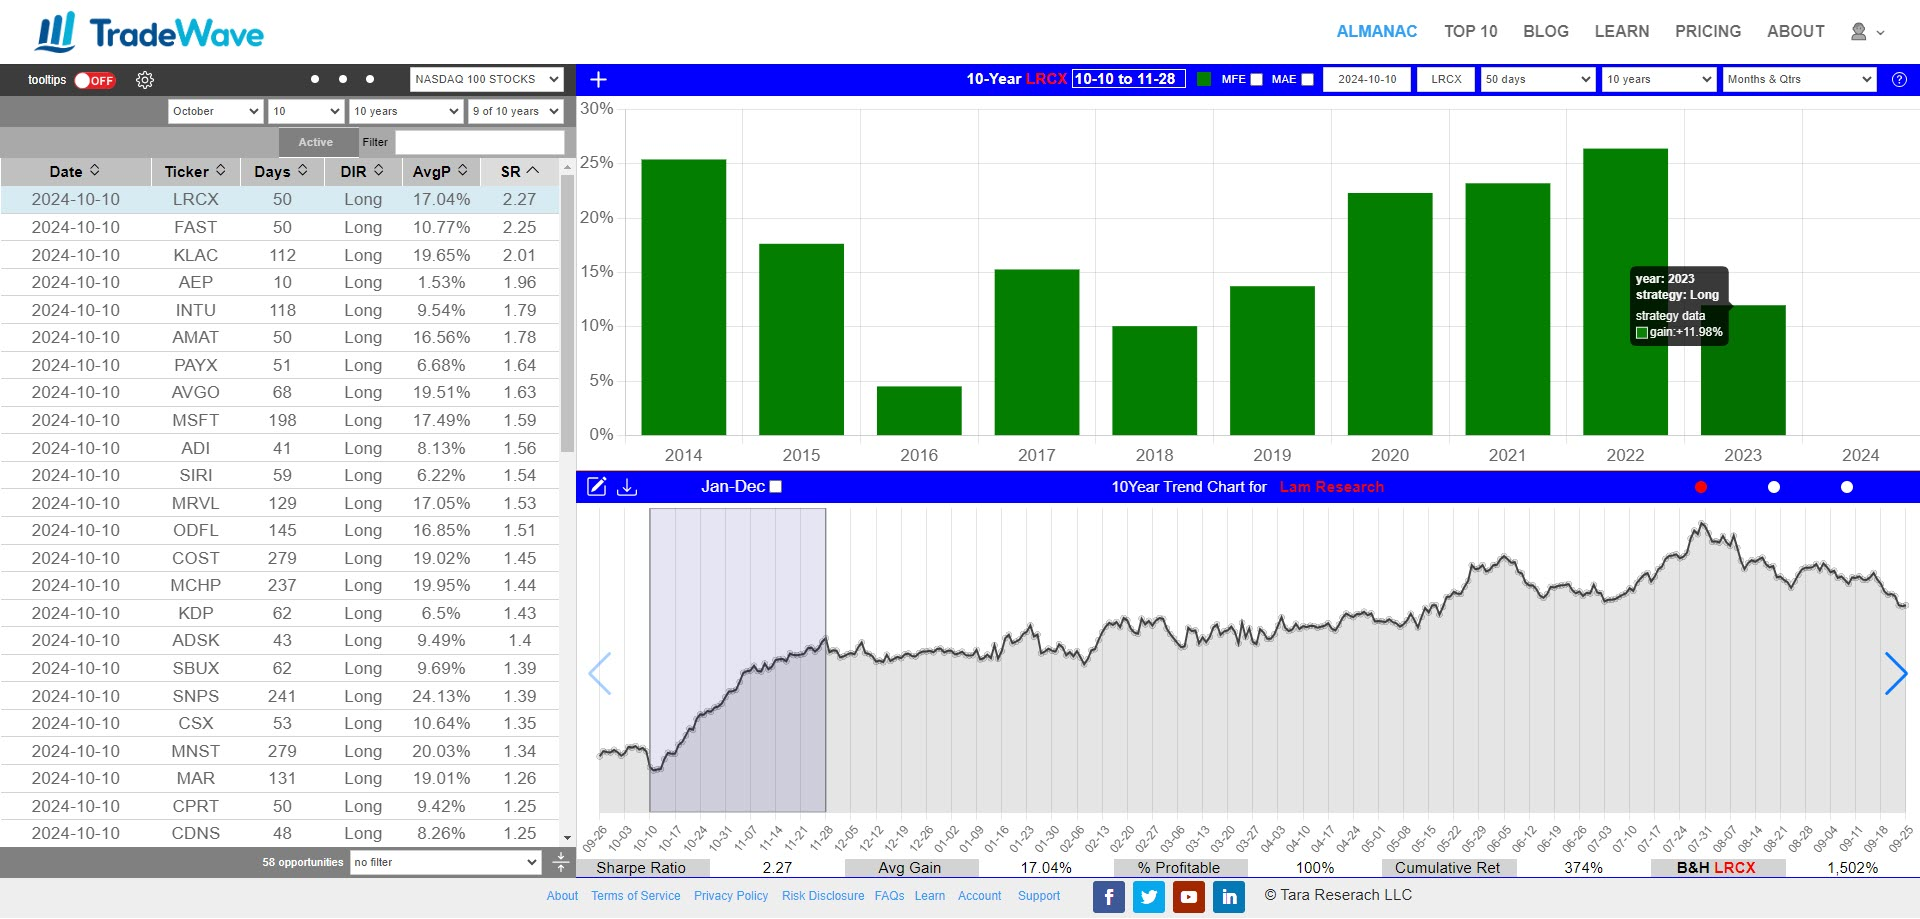
What Is the Trend Chart?
The Trend Chart helps traders identify the broader seasonal trend of a security throughout the year.
By combining historical data across multiple years, the chart highlights recurring periods of strength and weakness that may present high-probability trading opportunities.
Unlike standard price charts, the Trend Chart focuses specifically on seasonal behavior rather than long-term directional market growth.
Key Features of the Trend Chart
Overall Seasonal Trend
The chart displays average historical performance across selected years.
Strong upward or downward movements may indicate meaningful seasonal trends, while flatter behavior may suggest weaker or less reliable patterns.
Seasonal Trading Patterns
The Trend Chart highlights periods where a security has historically experienced recurring strength or weakness.
Traders often use these patterns to identify potential entry and exit windows.
Detrended Performance Analysis
TradeWave detrends each year’s data to remove the influence of long-term market appreciation or decline.
This allows traders to isolate seasonal behavior more accurately rather than confusing seasonal trends with broader market direction.
Visual Consistency Across Years
Color-coded bars make it easy to compare patterns across different years.
When multiple years display similar behavior during the same period, traders may view the pattern as more statistically meaningful.
How to Access the Trend Chart
Desktop Access
Click the left navigation dot on the horizontal blue ribbon to display the Trend Chart.
Mobile Access
Swipe the top chart left or right to access the Trend Chart display on mobile devices.
How Traders Use the Trend Chart
Identify Potential Seasonal Opportunities
Traders often look for periods where securities historically demonstrated recurring directional movement.
Evaluate Trend Strength
Larger bars may indicate stronger seasonal momentum and potentially higher-confidence opportunities.
Combine With Other TradeWave Tools
The Trend Chart is most effective when used alongside the Stats Table, Wave Viewer, and Historical Price Charts to create a more complete analytical framework.
Why the Trend Chart Matters
Seasonal trading is ultimately about probability and consistency.
The Trend Chart helps traders visualize recurring market behavior over time, making it easier to identify patterns that may repeat in future market cycles.