Key Takeaways:
- TradeWave analyzes trillions of data points to identify repeatable trading patterns across markets.
- You can discover high-probability seasonal trading opportunities for any day of the year.
- The Opportunities Table ranks trades using risk-adjusted metrics like Sharpe Ratio.
- Fully customizable timeframes allow you to test patterns across 10, 14, 20+ years of historical data.
- Every opportunity is interactive and can be explored instantly in the Wave Viewer.
What Is TradeWave and How Does It Find the Best Trading Waves?
TradeWave is a seasonal analytics platform designed to help traders and investors identify recurring market patterns based on time of year. By analyzing over a trillion data points, TradeWave surfaces high-probability trading waves, or patterns that have historically repeated across 10 or more years.
Whether you’re analyzing today’s market setup or planning ahead for future dates, TradeWave enables you to uncover statistically consistent opportunities across stocks and other financial instruments.
How TradeWave Uses Seasonal Analysis to Identify Trading Opportunities
TradeWave operates as a seasonal analytics environment, allowing users to test how specific securities perform during defined date ranges.
This process includes: - Backtesting historical price behavior across multiple years - Identifying recurring time-based patterns (seasonality) - Ranking the strongest opportunities daily using algorithmic analysis
Each day, TradeWave highlights the top 10 trading opportunities, helping traders quickly focus on the most statistically significant setups.
Customize Your Trading Analysis Across Multiple Timeframes
TradeWave gives you full control over how much historical data you want to analyze: - Default analysis: 10 years - Extend to: 14 years, 20 years, or more (based on available data) - Flexible inputs allow you to test both short-term and long-term seasonal trends
This flexibility allows traders to validate whether a pattern is consistent across different market cycles, improving confidence in the analysis.
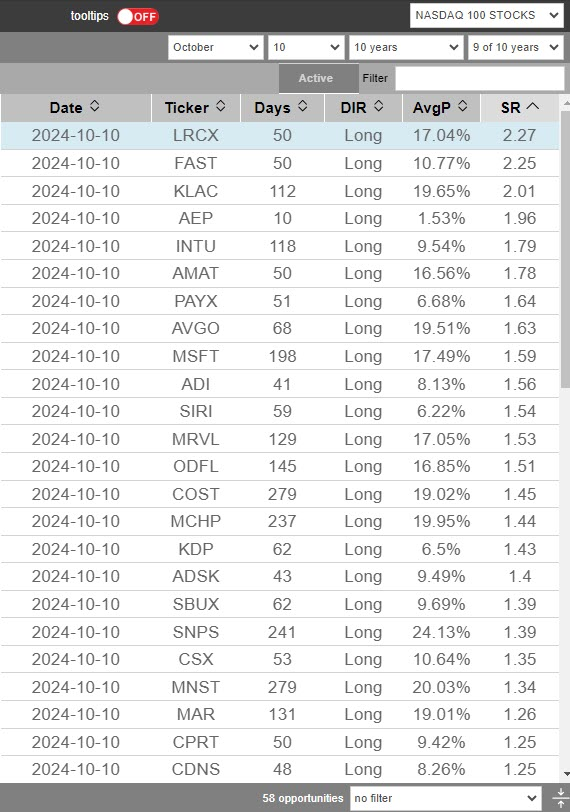
What Is the Opportunities Table in TradeWave?
The Opportunities Table is TradeWave’s central discovery tool. It functions like a dynamic trading almanac that surfaces the best seasonal opportunities for any given day.
Each opportunity is ranked by Sharpe Ratio (SR), helping you prioritize trades with the strongest balance of return and risk.
How to Read the Opportunities Table (Metrics Explained)
The Opportunities Table provides a snapshot of each trading wave using key performance metrics: - Date: The historical start and end dates when the wave typically occurs - Ticker: The security being analyzed (e.g., LRCX for Lam Research Corporation) - Days: The typical duration of the trading wave - DIR (Direction): Indicates whether the pattern trends upward or downward - AvgP (Average Performance): The historical average return during the wave - SR (Sharpe Ratio): Measures risk-adjusted returns, where higher values indicate more consistent performance
Together, these metrics allow traders to quickly evaluate both the potential return and reliability of a given opportunity.
How to Use the Opportunities Table With the Wave Viewer
Every opportunity in the table is fully interactive. - Click any entry to instantly load it into the Wave Viewer - Analyze detailed historical performance and trend behavior - Validate the strength and consistency of the trading wave
For example, selecting an opportunity like LRCX (Lam Research Corporation) opens a deeper view of that wave, allowing you to explore its historical performance and gain actionable insights in seconds.
Why TradeWave’s Data-Driven Approach Matters
By combining large-scale data analysis, seasonal pattern recognition, and intuitive visualization tools, TradeWave helps traders move beyond guesswork.
Instead of relying on intuition alone, you can identify trading opportunities grounded in historical probability, risk-adjusted performance, and repeatable market behavior.