Key Takeaways
- The Stats Table helps traders evaluate the historical reliability of a trading wave.
- Metrics like Sharpe Ratio, Percent Profitable, and Standard Deviation provide risk-adjusted context.
- Historical performance data helps traders compare opportunities more objectively.
- The Stats Table works alongside the Wave Viewer and Trend Chart to support better trade decisions.
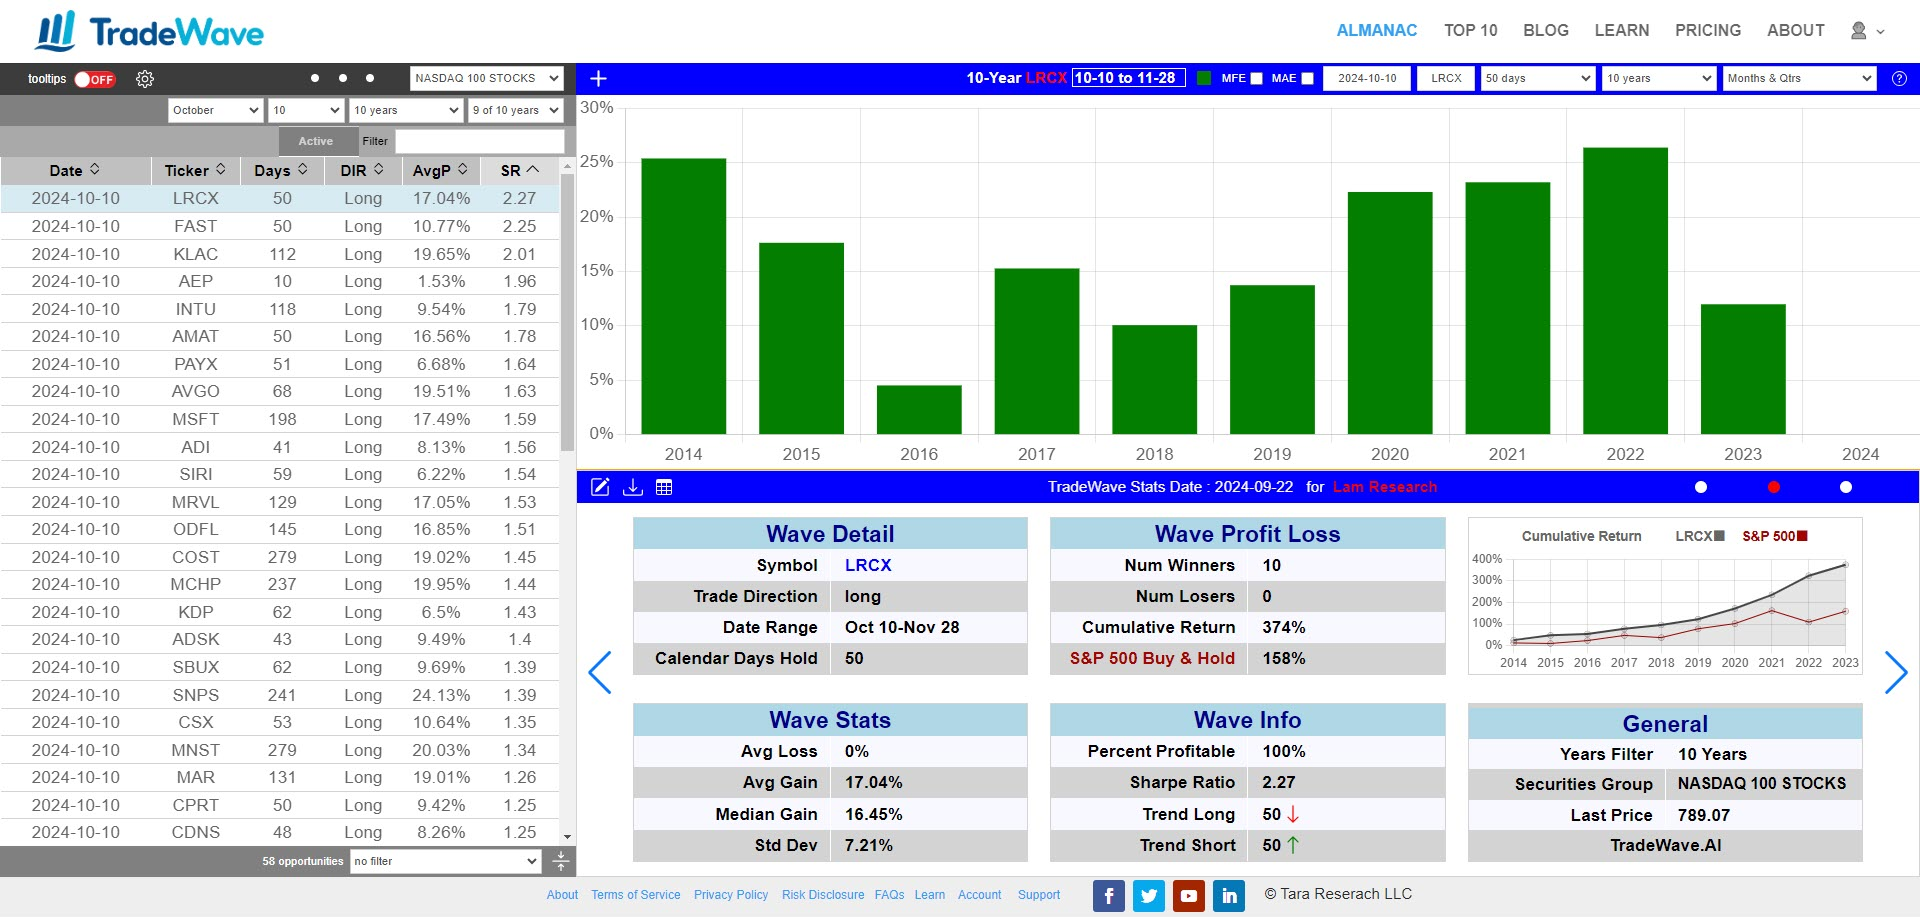
What Is the Stats Table in TradeWave?
The Stats Table is TradeWave’s primary tool for evaluating the historical performance of a trading wave. It gives traders a data-driven overview of how a security has historically behaved during a selected date range, helping identify opportunities with stronger consistency and better risk-adjusted performance.
By analyzing metrics such as average returns, volatility, profitability rates, and cumulative performance, traders can quickly determine whether a seasonal trend has historically demonstrated reliability.
TradeWave is a seasonal analytics environment designed to help investors and traders identify recurring market patterns based on time of year. The platform tests date ranges across financial instruments and algorithmically surfaces top trading opportunities each day.
How to Read the Stats Table
Avg Gain
Avg Gain represents the average percentage gain achieved during the selected date range across all analyzed years. Higher values suggest stronger historical upside performance.
Avg Loss
Avg Loss shows the average percentage decline during the same period. Lower losses may indicate stronger downside control and more stable seasonal behavior.
Median Gain
Median Gain reflects the “typical” historical outcome by removing the influence of extreme outlier years. This often provides a clearer picture of consistency.
Standard Deviation (Std Dev)
Standard Deviation measures volatility during the selected period. Lower volatility generally suggests more stable seasonal performance, while higher volatility indicates larger price fluctuations.
Percent Profitable
This metric shows how often the wave finished positive across analyzed years. A higher percentage may indicate stronger historical reliability.
Sharpe Ratio
The Sharpe Ratio measures risk-adjusted return. Higher Sharpe Ratios indicate stronger returns relative to the amount of volatility or risk taken, making this one of the platform’s most important evaluation metrics.
Winners and Losers
The Winners/Losers columns display how many historical periods ended positively versus negatively. Traders often use this metric to evaluate consistency and probability.
Cumulative Return vs. S&P 500 Buy & Hold
Cumulative Return measures the total return generated by trading only the selected date range across all analyzed years.
TradeWave also compares this performance to a traditional S&P 500 Buy & Hold strategy, helping traders determine whether a seasonal wave historically outperformed the broader market.
How to Access the Stats Table
If the Stats Table is not visible, click the center navigation dot on the horizontal blue ribbon.
This opens a detailed statistical view of the selected wave, allowing you to evaluate performance quality, consistency, volatility, and historical profitability before making trading decisions.
Why the Stats Table Matters for Seasonal Trading
Successful seasonal trading depends on more than identifying patterns - it requires understanding whether those patterns have historically demonstrated consistency, favorable risk-adjusted returns, and repeatable behavior.
The Stats Table gives traders the statistical context needed to evaluate opportunities with greater confidence and discipline.