Key Takeaways
- Historical Price Charts show how a security behaved during specific years.
- Traders can analyze how seasonal patterns performed under different market environments.
- Year-by-year comparisons help identify recurring trends and anomalies.
- Historical context strengthens long-term seasonal analysis and strategy development.
What Are Historical Price Charts?
Historical Price Charts allow traders to analyze how a security performed during a specific year within a selected seasonal wave.
Instead of viewing only aggregated historical averages, traders can drill down into individual years to better understand how the market behaved under varying economic conditions, volatility regimes, and macro environments.
This deeper level of analysis helps traders identify both consistency and exceptions within seasonal patterns.
How to Access Historical Price Charts
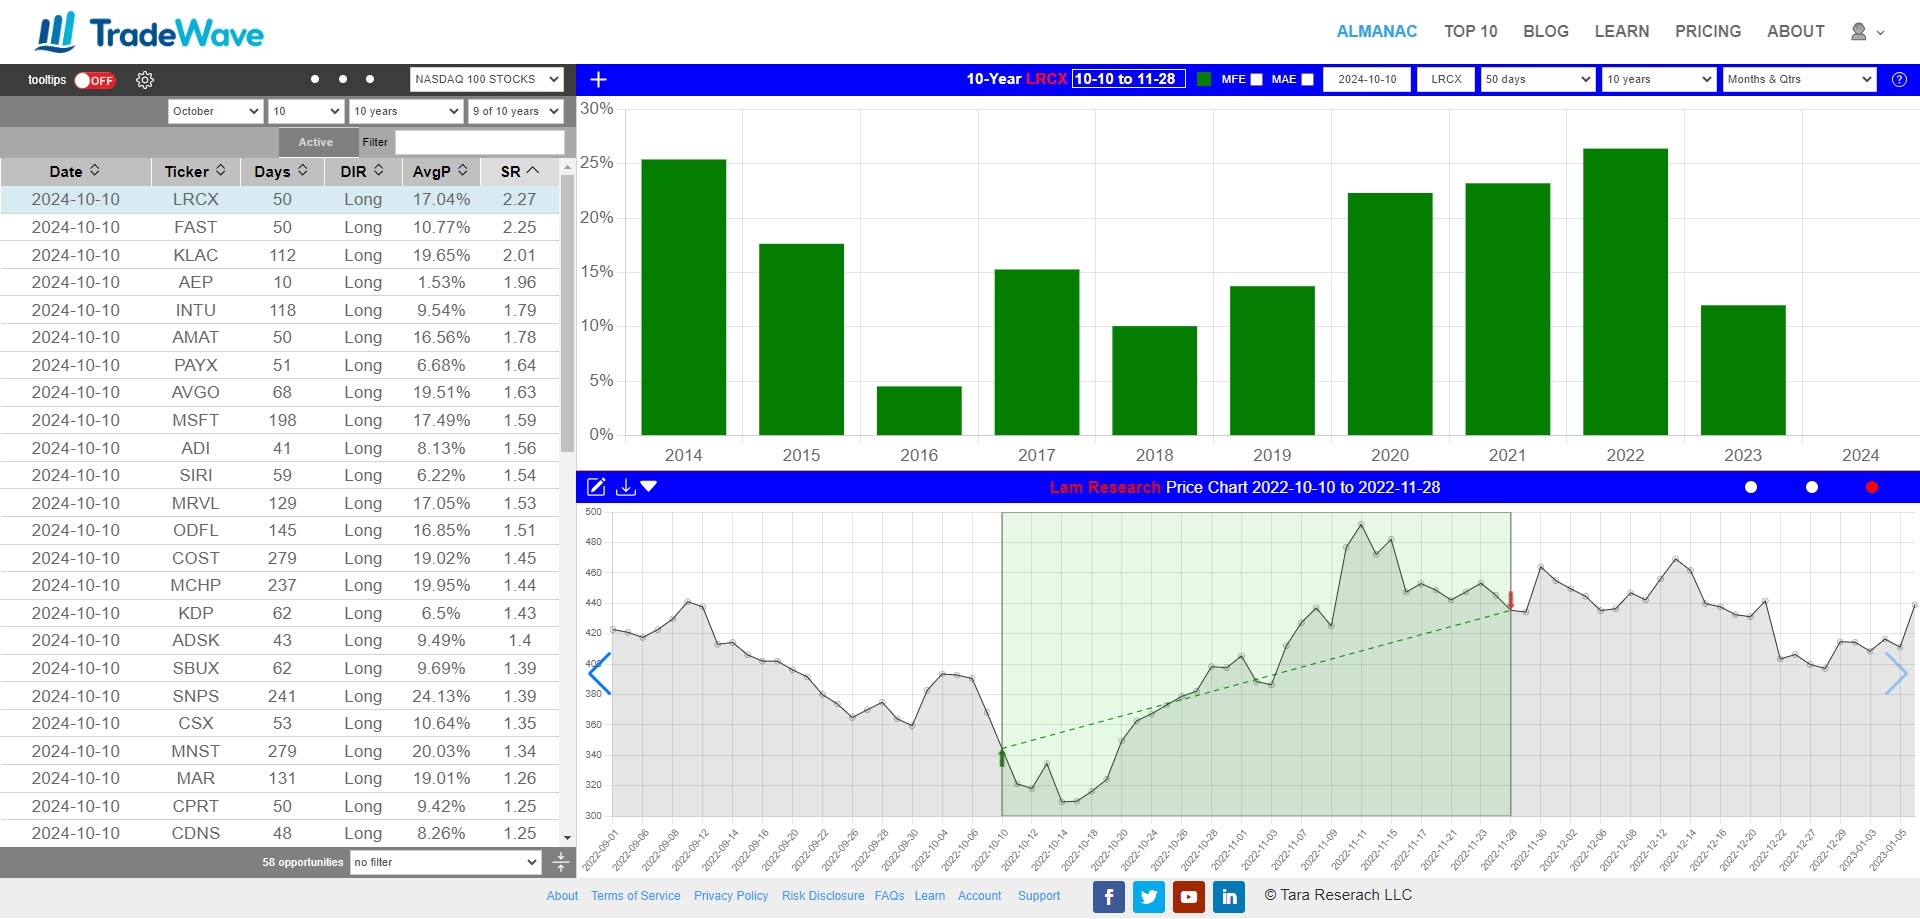
Click any bar in the bar chart to display the Historical Price Chart for that specific year.
For example, selecting the 2022 bar loads the security’s historical performance throughout 2022. TradeWave will automatically switch to the chart view using the right navigation display.
You can also manually access Historical Price Charts by clicking the right navigation dot on the horizontal blue ribbon.
How to Analyze Historical Trading Behavior
Perform Year-by-Year Analysis
Each selected year provides a detailed snapshot of how the security behaved during that historical period.
This allows traders to evaluate how the same seasonal wave performed during different market environments.
Identify Seasonal Consistency
Comparing multiple years helps reveal recurring seasonal trends, recurring strengths or weaknesses, and periods where patterns broke down.
Study Market Context
Historical Price Charts can also provide insight into how macroeconomic events, earnings cycles, interest rate changes, or broader market conditions influenced performance.
Why Historical Price Charts Matter
Seasonal analysis becomes significantly more powerful when traders can move beyond averages and evaluate individual historical outcomes.
Historical Price Charts provide the context needed to understand how patterns behaved across changing market conditions, helping traders build more informed and adaptable strategies.