Based on the last 9 consecutive years, TradeWave identified a recurring short seasonal pattern in XRP (XRP-USD) between Aug 12 and Sep 14. The charts and statistics below show the consistency, risk profile, and year-by-year performance of holding this trade across each historical cycle.
Load on Wave Viewer
XRP TradeWave Opportunity Key Informationi
The financial market is an ever-changing landscape, and investors need to stay on top of key indicators to make informed decisions. The key stats below provide a quick and comprehensive overview of the TradeWave opportunity and its quality.
Symbol
XRP-USD is the unique ticker symbol identifying the financial instrument analyzed in this report.
Trade Direction
Indicates whether the historical pattern favored the long (buy) or short (sell) side, based on the instrument's performance over the date range.
Date Range
Specifies the period over which the financial instrument is analyzed.
Days Held
The holding period this analysis is based on, counted from the start date. The end date is derived from start-date and days-held.
History Years
The number of years of historical data this report is based on. This report uses 9 years.
Securities Group
Categorizes the financial instrument by sector, industry, asset class, or market segment.
Number of Winners / Losers
Counts of trades that resulted in profits vs. losses during the analyzed period - direct measures of reliability and risk.
Percent Profitable
Percentage of profitable trades out of the total executed.
Average Gain / Average Loss
Mean gain per winning trade and mean loss per losing trade - drives expected value.
Biggest Winner
The largest gain from a single trade in the analyzed period.
Median Gain
The middle value of all gains - reduces the impact of outliers compared to the mean.
Standard Deviation
Variability of profits and losses. Lower means more consistent; higher means more volatile.
Cumulative Return
Total return on investment over the analyzed period.
Sharpe Ratio
Risk-adjusted return. Higher = better return for the level of risk taken.
Trend Long / Trend Short
Strength of the recent upward and downward trend in the instrument's price.
| Symbol | XRP-USD |
| Trade Direction | Short |
| Date Range | Aug 12 – Sep 14 |
| Days Held | 34 |
| History Years | 9 |
| Securities Group | CRYPTO CURRENCIES |
| Num Winners | 7 |
| Num Losers | 2 |
| Percent Profitable | 78% |
| Biggest Winner | 21.96% |
| Avg Gain | 11.17% |
| Avg Loss | -9.25% |
| Median Gain | 7.16% |
| Standard Deviation | 10.49% |
| Cumulative Return | 71% |
| Sharpe Ratio | 0.6 |
| Trend Long | 0 |
| Trend Short | 74 |
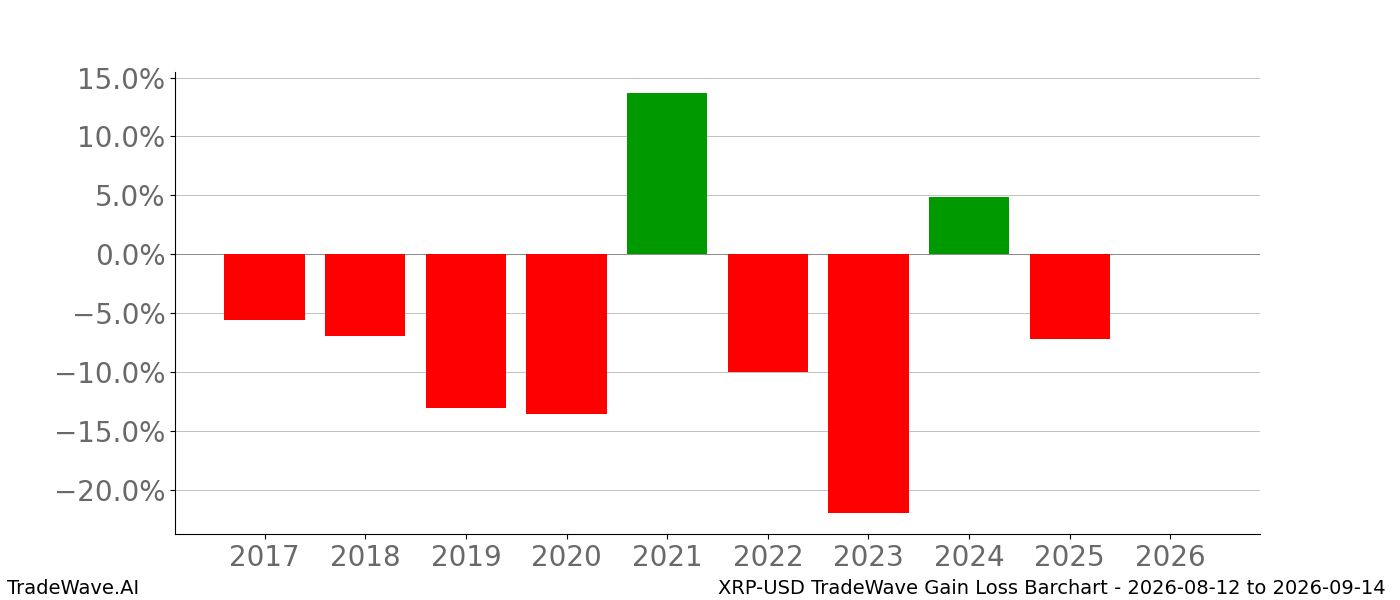
XRP-USD Gain Loss BarCharti
This chart shows the percentage gain or loss of buying XRP-USD on Aug 12th and selling on Sep 14th. Green = profitable year, red = losing year. Mostly green bars indicate a strong bullish TradeWave pattern; consistent bar sizes indicate low Standard Deviation.
Sharpe Ratio is a critical consistency indicator. ≥ 1.0 typically reflects consistent year-to-year positive outcomes. Note that the historical sample size influences the Sharpe Ratio's interpretation.
Data is covering 9 years of history. When assessing the Sharpe Ratio, account for the number of historical years.
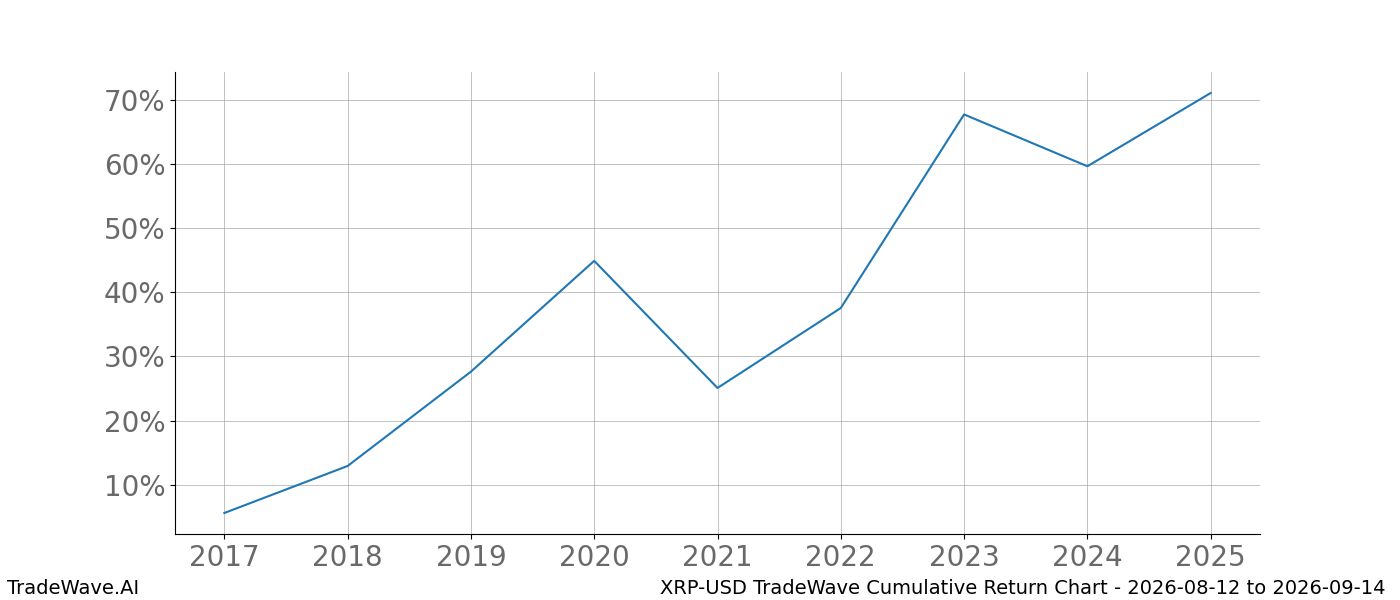
XRP-USD Cumulative Return Charti
Shows the total compounded growth from holding the XRP-USD pattern from Aug 12th to Sep 14th year-over-year. Useful for understanding long-term trend strength versus single-year volatility.
Compare the slope across years: a steady upward slope suggests a robust pattern; flat or oscillating segments indicate years where the pattern weakened.
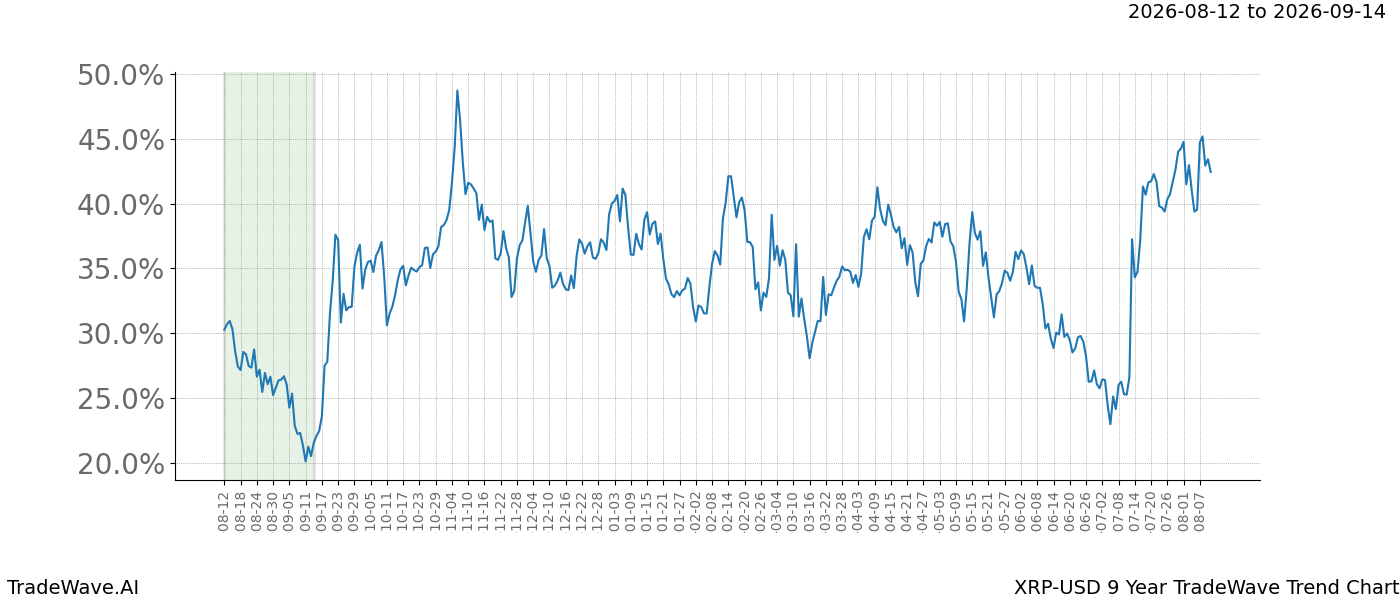
XRP-USD 9 Year TradeWave Trend Charti
The detrended average price movement throughout the year for XRP-USD, covering 9 years of history. The shaded box marks the date range opportunity (Aug 12th to Sep 14th); its color (green/red) reflects the direction the historical pattern favored.
Use this chart to evaluate how well the date range aligns with historical seasonal trends. Adjusting the window in the Wave Viewer can reveal nearby improvements in profitability or risk.
TradeWave analysis examines historical patterns in an asset's price movements during specific times of the year. By integrating these insights into trading strategies, investors can anticipate market movements influenced by seasonal trends, economic cycles, and recurring events.
This report provides a thorough analysis of XRP-USD's historical price movements within the specified date range. Past performance does not guarantee future results - but recurring seasonal patterns offer a data-driven edge for risk management and timing decisions.