The 100-Year PatternS&P 500U.S. midterm years only24 completed cycles
Public S&P 500 historical record
The 100-Year Pattern24 completed cycles.96% finished positive.
One fixed S&P 500 window: September 27 of every U.S. presidential midterm election year through July 18 of the following year. This record begins in 1930. Out of 24 completed windows, 23 ended above their starting close.
If you invest in, trade, or follow U.S. equities, this is a recurring historical period worth knowing before it begins again. We are publishing every result, every drawdown, and the raw data so you can evaluate it for yourself.
Public record · No email · No account · Raw data included
All 24 completed cycles are historical and in-sample. The 2026 to 2027 result remains unknown. Historical results do not guarantee what happens next.
Why this deserves attention
A historically favorable S&P 500 window is approaching again.
From September 27 of every U.S. presidential midterm election year through July 18 of the following year, 23 of 24 completed windows since 1930 ended above their starting close. That does not tell anyone what to buy, and it does not guarantee the next result. It is a recurring piece of market history worth knowing.
Exactly what the 100-Year Pattern measures
One fixed S&P 500 window starting in every U.S. presidential midterm election year.
This is not an every-year study. It measures the same calendar window in one specific year of the four-year U.S. presidential cycle.
of the U.S. midterm election year
295calendar dayscounted inclusively
of the following year
If an endpoint is not a trading day, use the first trading day after it.
In 2026, September 27 and July 18 both fall on Sunday, so the analyzed dates resolve to September 28, 2026 and July 19, 2027.
The comparison keeps the same position in the four-year cycle.
TradeWave labels the midterm year PE+2. This record compares PE+2 years with earlier PE+2 years; it makes no claim about the other three year types.
Counting example: July 1 through July 31 is 31 days. This is TradeWave's general calendar convention - not special handling created for this pattern.
Prior work and exact dates
This season was documented before TradeWave.
A favorable stretch of the four-year presidential cycle running from the midterm year into the pre-election year is documented in the Stock Trader's Almanac, where Jeffrey Hirsch calls it the Sweet Spot and defines it in quarters: Q4 of the midterm year through Q2 of the pre-election year. The season is not a TradeWave finding and is not claimed as one here.
What this page adds is resolution and a different boundary. The Almanac's Sweet Spot begins in Q4. This record begins September 27, before Q4 opens, and runs to July 18, past Q2's close. Those two dates are fixed, scored across all 24 completed cycles, published with the drawdown inside each one, and downloadable as raw data.
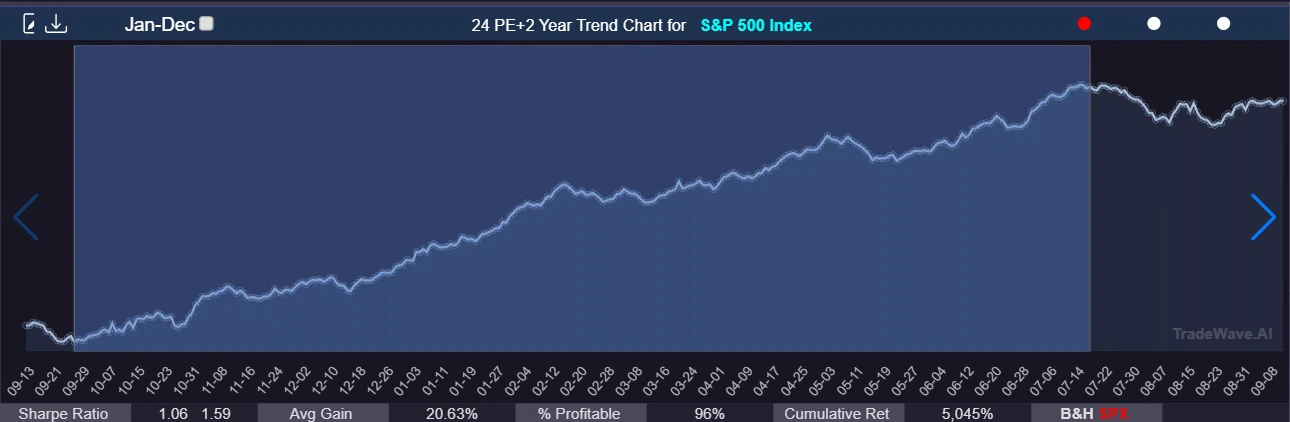
Visual bottom area · late SeptemberSelected window · September 27 to July 18
Swipe to inspect the complete Trend Chart →
Repeatable workflow
September 27 to July 18 produced the highest cumulative return in the date-window test. The visual turning area identified the region; testing fixed date pairs against all 24 completed cycles selected the exact days.
The complete historical record
23 positive outcomes. Every return and drawdown shown.
All 24 completed U.S. midterm cycles from 1930 through 2022 are included. The unresolved 2026 to 2027 cycle is not.
1978 finished +0.03% before transaction costs and is therefore classified as a positive close-to-close return.
How every U.S. midterm cycle finished, and what happened along the way
Window return shows the finish. MFE shows the best move. MAE shows the worst drawdown. All values are measured from the resolved entry.
Unresolved2026
Window return - the close-to-close result
MFE - highest favorable move during the window
MAE - deepest adverse move during the window
Excursions show the path inside each window; they are not additional returns. Hover or focus a year for exact values.
winning cycles moved below the entry price at some point before finishing positive.
The window suffered the deepest non-1930 adverse move and still closed +2.78%.
1974 finished the window at +43.52% after reaching the largest favorable excursion in the record.
Every completed midterm observation
All 24 U.S. midterm cycles, row by row.
Every historical cycle in the study is shown. The unresolved 2026 to 2027 cycle is excluded because it has not begun.
| Cycle | Year | Nominal window | Resolved entry | Resolved exit | Return | MFE | MAE | MAE basis |
|---|---|---|---|---|---|---|---|---|
| 01 | 1930 | 09-27 → 07-18 | 09/29/1930 | 07/20/1931 | -23.41% | +2.86% | -35.38% | Close |
| 02 | 1934 | 09-27 → 07-18 | 09/27/1934 | 07/18/1935 | +16.12% | +16.23% | -12.20% | Close |
| 03 | 1938 | 09-27 → 07-18 | 09/27/1938 | 07/18/1939 | +10.65% | +26.57% | -5.19% | Close |
| 04 | 1942 | 09-27 → 07-18 | 09/28/1942 | 07/19/1943 | +41.17% | +42.18% | -0.45% | Close |
| 05 | 1946 | 09-27 → 07-18 | 09/27/1946 | 07/18/1947 | +4.90% | +6.82% | -8.87% | Close |
| 06 | 1950 | 09-27 → 07-18 | 09/27/1950 | 07/18/1951 | +12.73% | +17.52% | -2.11% | Close |
| 07 | 1954 | 09-27 → 07-18 | 09/27/1954 | 07/18/1955 | +30.22% | +32.74% | -2.61% | Close |
| 08 | 1958 | 09-27 → 07-18 | 09/29/1958 | 07/20/1959 | +18.13% | +20.37% | +0.22% | Close* |
| 09 | 1962 | 09-27 → 07-18 | 09/27/1962 | 07/18/1963 | +22.81% | +27.74% | -5.77% | Intraday |
| 10 | 1966 | 09-27 → 07-18 | 09/27/1966 | 07/18/1967 | +19.72% | +21.96% | -7.45% | Intraday |
| 11 | 1970 | 09-27 → 07-18 | 09/28/1970 | 07/19/1971 | +17.90% | +25.85% | -2.00% | Intraday |
| 12 | 1974 | 09-27 → 07-18 | 09/27/1974 | 07/18/1975 | +43.52% | +48.72% | -6.13% | Intraday |
| 13 | 1978 | 09-27 → 07-18 | 09/27/1978 | 07/18/1979 | +0.03% | +4.50% | -9.85% | Intraday |
| 14 | 1982 | 09-27 → 07-18 | 09/27/1982 | 07/18/1983 | +32.62% | +38.81% | -2.82% | Intraday |
| 15 | 1986 | 09-27 → 07-18 | 09/29/1986 | 07/20/1987 | +35.44% | +36.83% | 0.00% | Close |
| 16 | 1990 | 09-27 → 07-18 | 09/27/1990 | 07/18/1991 | +28.04% | +30.00% | -2.15% | Intraday |
| 17 | 1994 | 09-27 → 07-18 | 09/27/1994 | 07/18/1995 | +20.87% | +21.84% | -4.15% | Intraday |
| 18 | 1998 | 09-27 → 07-18 | 09/28/1998 | 07/19/1999 | +34.23% | +35.44% | -11.95% | Intraday |
| 19 | 2002 | 09-27 → 07-18 | 09/27/2002 | 07/18/2003 | +20.06% | +22.73% | -7.10% | Intraday |
| 20 | 2006 | 09-27 → 07-18 | 09/27/2006 | 07/18/2007 | +15.68% | +16.41% | -0.71% | Intraday |
| 21 | 2010 | 09-27 → 07-18 | 09/27/2010 | 07/18/2011 | +14.30% | +20.00% | -0.90% | Intraday |
| 22 | 2014 | 09-27 → 07-18 | 09/29/2014 | 07/20/2015 | +7.61% | +7.93% | -7.95% | Intraday |
| 23 | 2018 | 09-27 → 07-18 | 09/27/2018 | 07/18/2019 | +2.78% | +3.56% | -19.47% | Intraday |
| 24 | 2022 | 09-27 → 07-18 | 09/27/2022 | 07/18/2023 | +24.89% | +25.09% | -4.27% | Intraday |
Download the 24-cycle CSV Ungated · 24 rows · nominal and resolved dates included
Limits and scoring
How the 100-Year Pattern record is calculated, and where its claims stop.
Calculation
Returns are SPX price returns calculated close-to-close from the resolved entry and exit shown in the CSV. A positive result means the exit close is higher than the entry close. No transaction costs or slippage are included.
Excursions
The chart reproduces TradeWave's displayed MFE and MAE. Early-history MAE is close-based; later history uses intraday data where available. The CSV retains the separate fields.
Historical, then prospective
All 24 completed cycles were used to identify and evaluate this pattern and are therefore in-sample. They document historical repetition; they are not independent validation or a mathematical law. The 2026 to 2027 cycle is the first prospective out-of-sample test and remains excluded from every historical statistic until it resolves.
Not a like-for-like comparison
The 118% buy-and-hold figure shown in the book and TradeWave export uses Jan 1 to Jan 1 annual periods. It is not a like-for-like Sep to Jul benchmark, so it is not plotted here.
First out-of-sample test.
The rule, dates, full historical record, raw CSV, and scoring convention for the cycle from 2026 to 2027 are public before the nominal start date.
Excursion note: 1958 is displayed at +0.22% MAE in TradeWave while the close series floors the entry baseline at 0.00%. In 1986, the TradeWave display is 0.00% while the separate intraday field records -0.80% on the entry date. Both source fields remain visible in the downloadable CSV.
Optional research tool
This page gives you the finding. TradeWave helps you investigate the timing.
You do not need TradeWave to understand or use the public record above. If you want more precision, TradeWave lets you inspect resolved trading dates, the historical daily path, drawdowns, and the same Trend Chart process on other supported securities and year ranges.
Optional · The complete 100-Year Pattern record remains public aboveStart with this public finding→Inspect the historical daily path→Apply the process to your symbols

2026 edition · updated and expanded
Read the research
The book explains how the pattern was found, what happened in each cycle, and why 2026 matters.
The complete historical record is public above. The 100-Year Pattern adds the seasonal context, the TradeWave research process, and the story behind September 27. The current printing also contains the author's public correction and edition note.
Read the correction and edition note